Climate Resiliency and Preparedness
The City completed the Resilient Cambridge Plan as a roadmap to reduce the risks from climate change and prepare the community for impacts that cannot be avoided. The Plan focuses on the threats from increasing temperature, precipitation, and sea level rise.
In February of 2023, the Cambridge City Council adopted new zoning requirements to address the long-term impacts of increased flooding and heat from climate change. The Climate Resilience Zoning was recommended by a task force of community partners including residents, housing and commercial developers, institutions, climate change experts, and City staff. They are based on the City’s climate projections over the next 50 years and will be updated from time to time. Current FloodViewer Map, FloodViewer 2025, was released as an update in November 2025.
Reports and additional information are located in the "Useful Documents & Resources” Tab to the right.
FloodViewer Mapping Tool
To support the City’s Resiliency planning efforts, the City created the FloodViewer Mapping Tool.
Use this tool to help understand the risk of flooding to your property and how to protect against it. The FloodViewer has been developed as an informational tool for the Cambridge community to asses climate change threats from flooding and to prepare for it by implementing specific strategies.
The FloodViewer is also the tool that establishes the Long Term Flood Elevations, “LTFE”, for all specific parcels, as defined by the Climate. Resilience Zoning Amendment that was adopted by the City in February of 2023.
Using the FloodViewer
It is recognized that projected flood information presented in the Flood Viewer are based on climate change scenarios that are drawn from the best available science but involve ranges of uncertainty.
FloodViewer 2025
The FloodViewer 2025 is available at the link below and in the current map for all LTFE Determinations associated with meeting the standards of the City's Climate Resiliency Zoning.
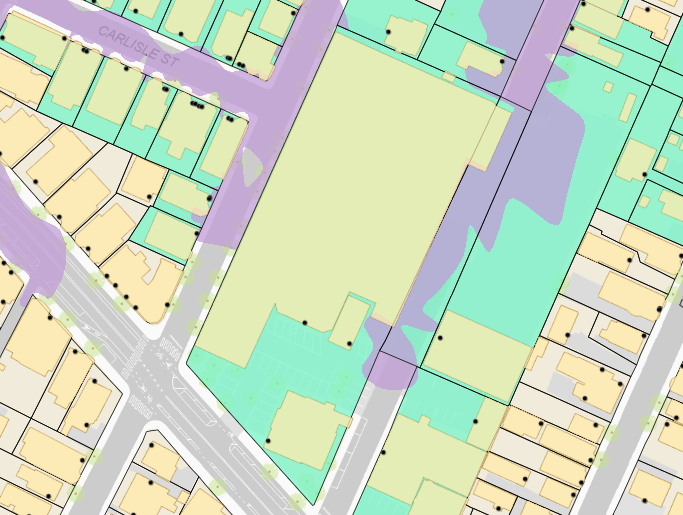
Click the image above to view the map.
FloodViewer 2025
For Information and Assistance
The provided flood information will need to be revisited frequently to ensure that our community preparedness efforts continue to reflect updated projections specific to local climate change. Please contact FloodViewer@cambridgema.gov with questions or help using the map.